Welcome to My IMT 561 Portfolio

Photo of Samantha Wang

Samantha Wang

I am a master’s student in Information Management at the University of Washington, focusing on Data Science and Business Intelligence.

This quarter, I want to improve my ability to turn data into clear, engaging, and interactive visual stories.

One topic I am excited to visualize is music listening behavior, because it connects personal preferences, daily routines, and broader patterns in digital media use.

Documenting Iterative Process

Context of use: This clock is designed for meeting-heavy workdays. It helps working professionals quickly understand when their day becomes busy without reading each calendar event. I chose this context because I often need a fast, low-stress way to understand workload during focused school and work sessions.

Final Clock 1 — Meeting Wave Clock

Sketch iteration documentation (paper / hand-drawn photos)

Meeting Wave Clock hand-drawn sketch
Initial sketch: meeting load is represented as a wave across the workday.
Meeting Wave Clock final digital design
Final version: clearer wave shape, stronger red/blue contrast, and improved time axis.

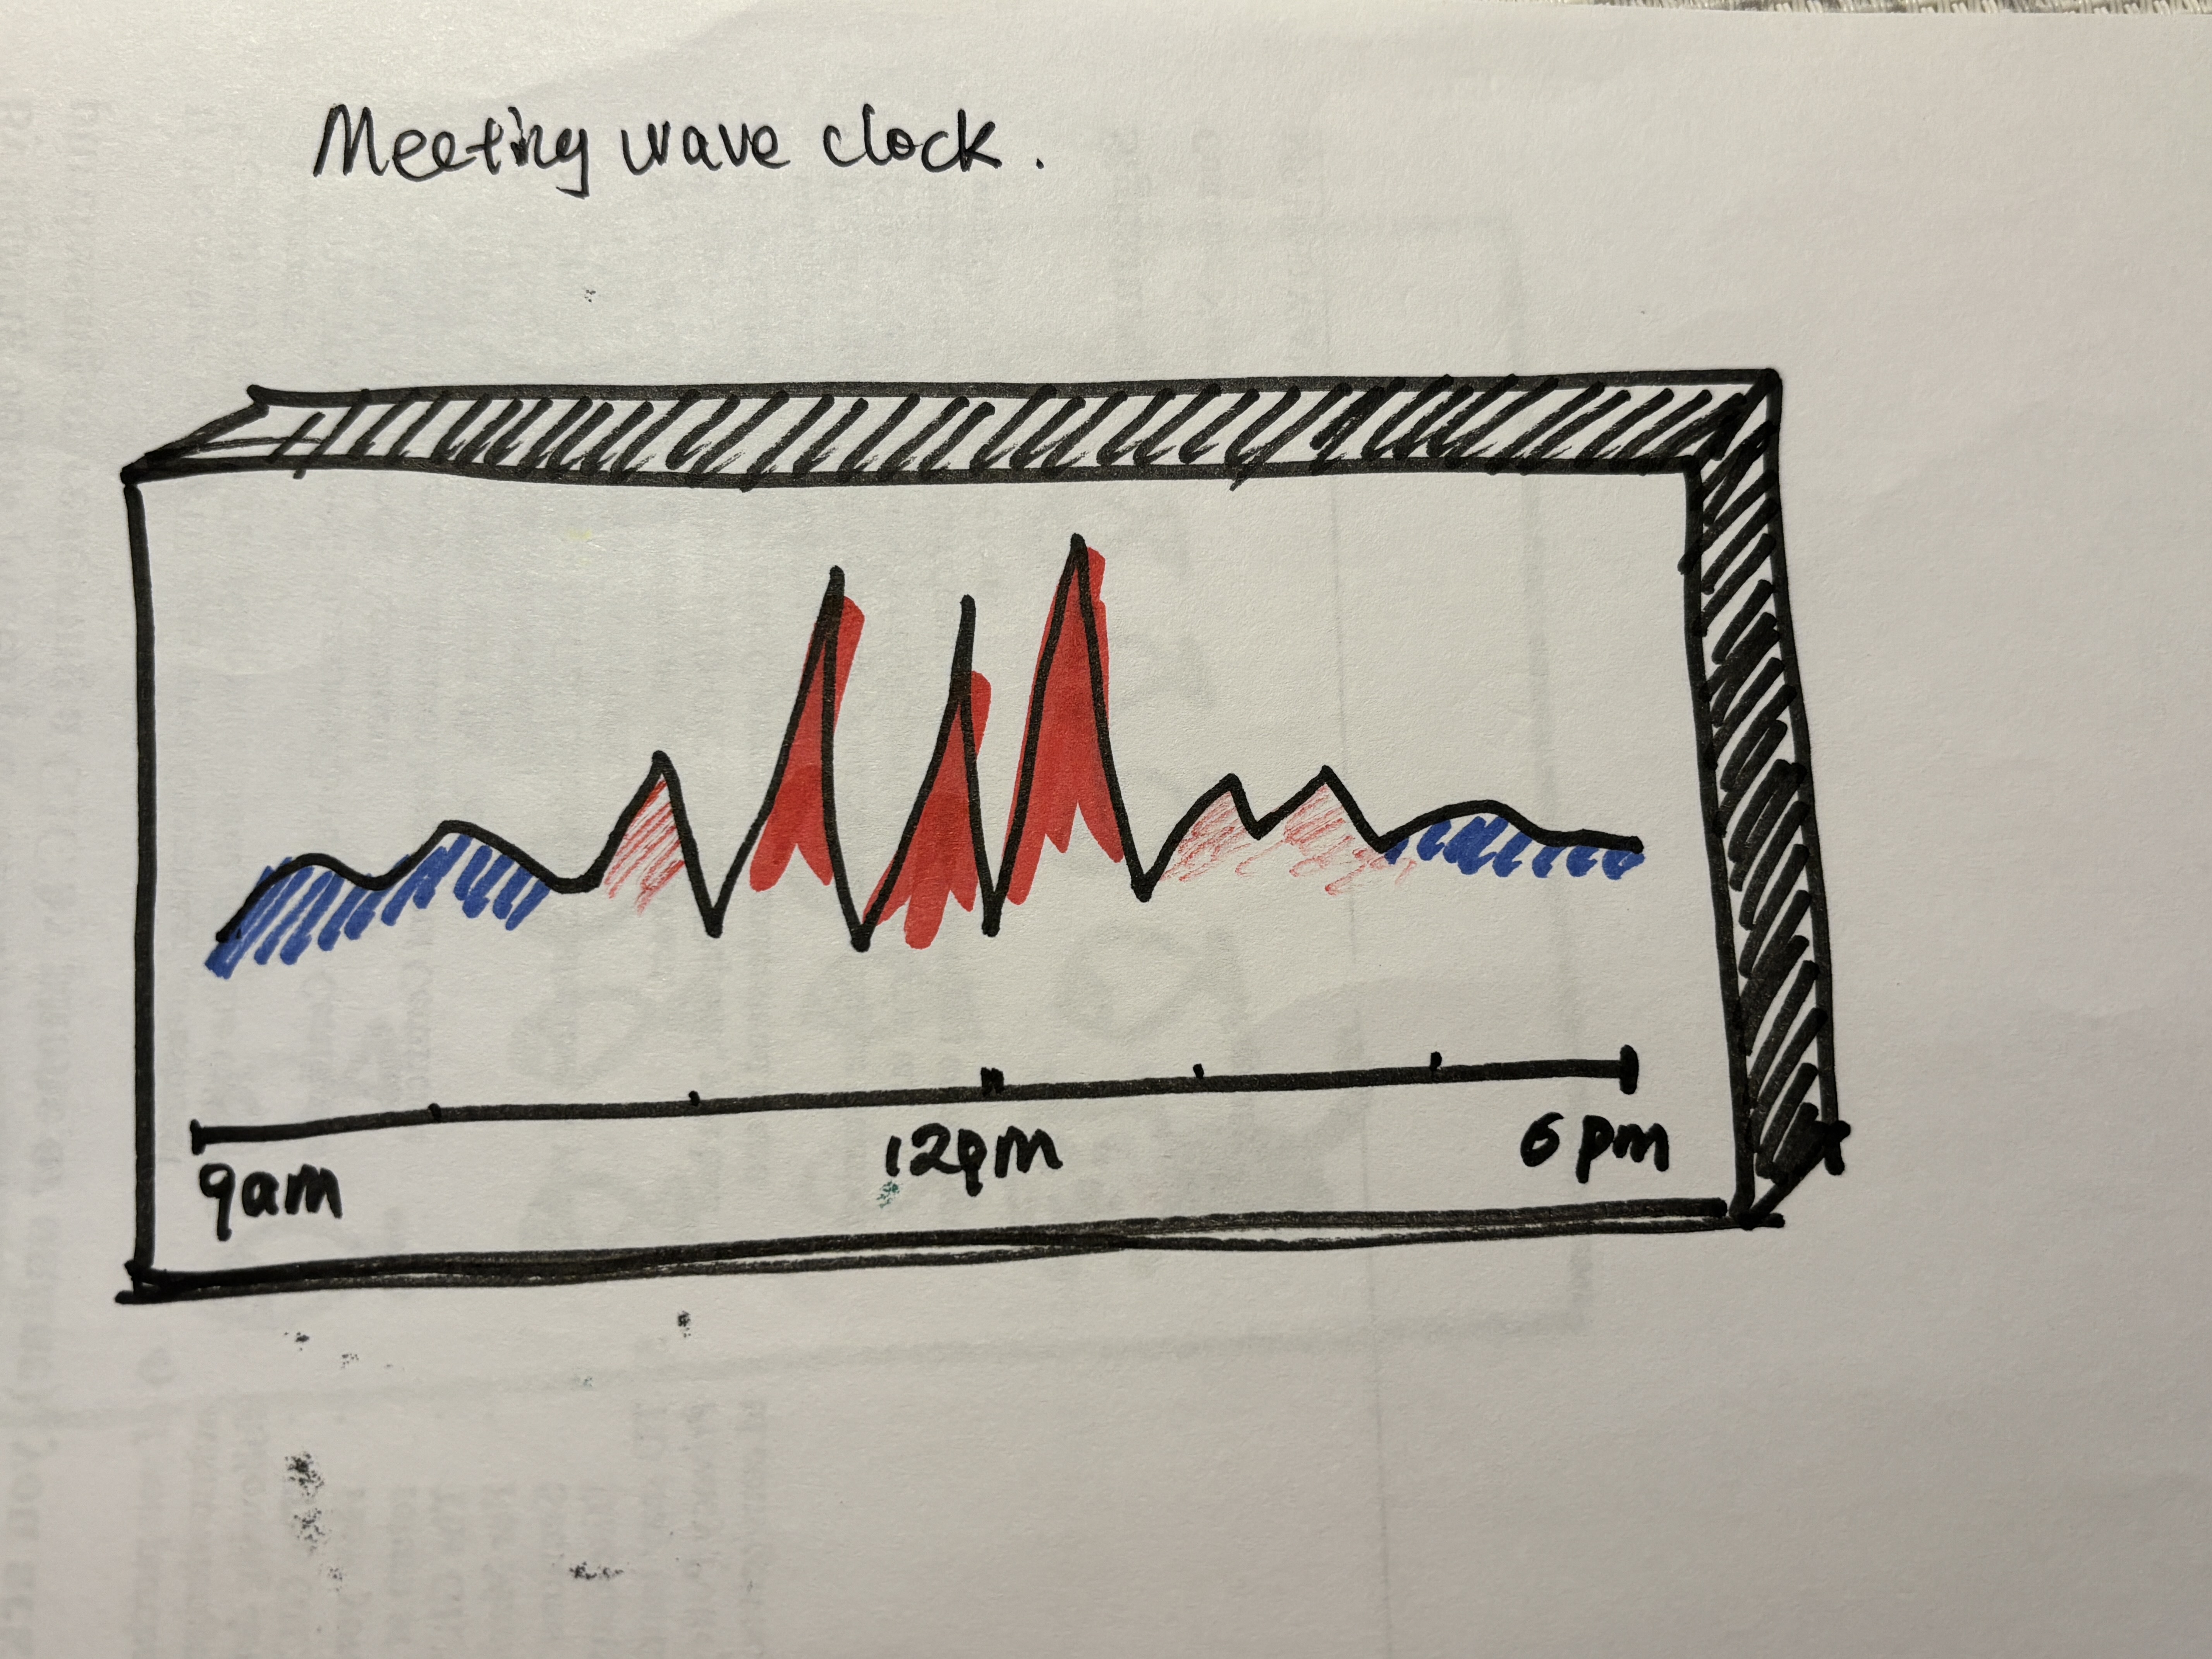
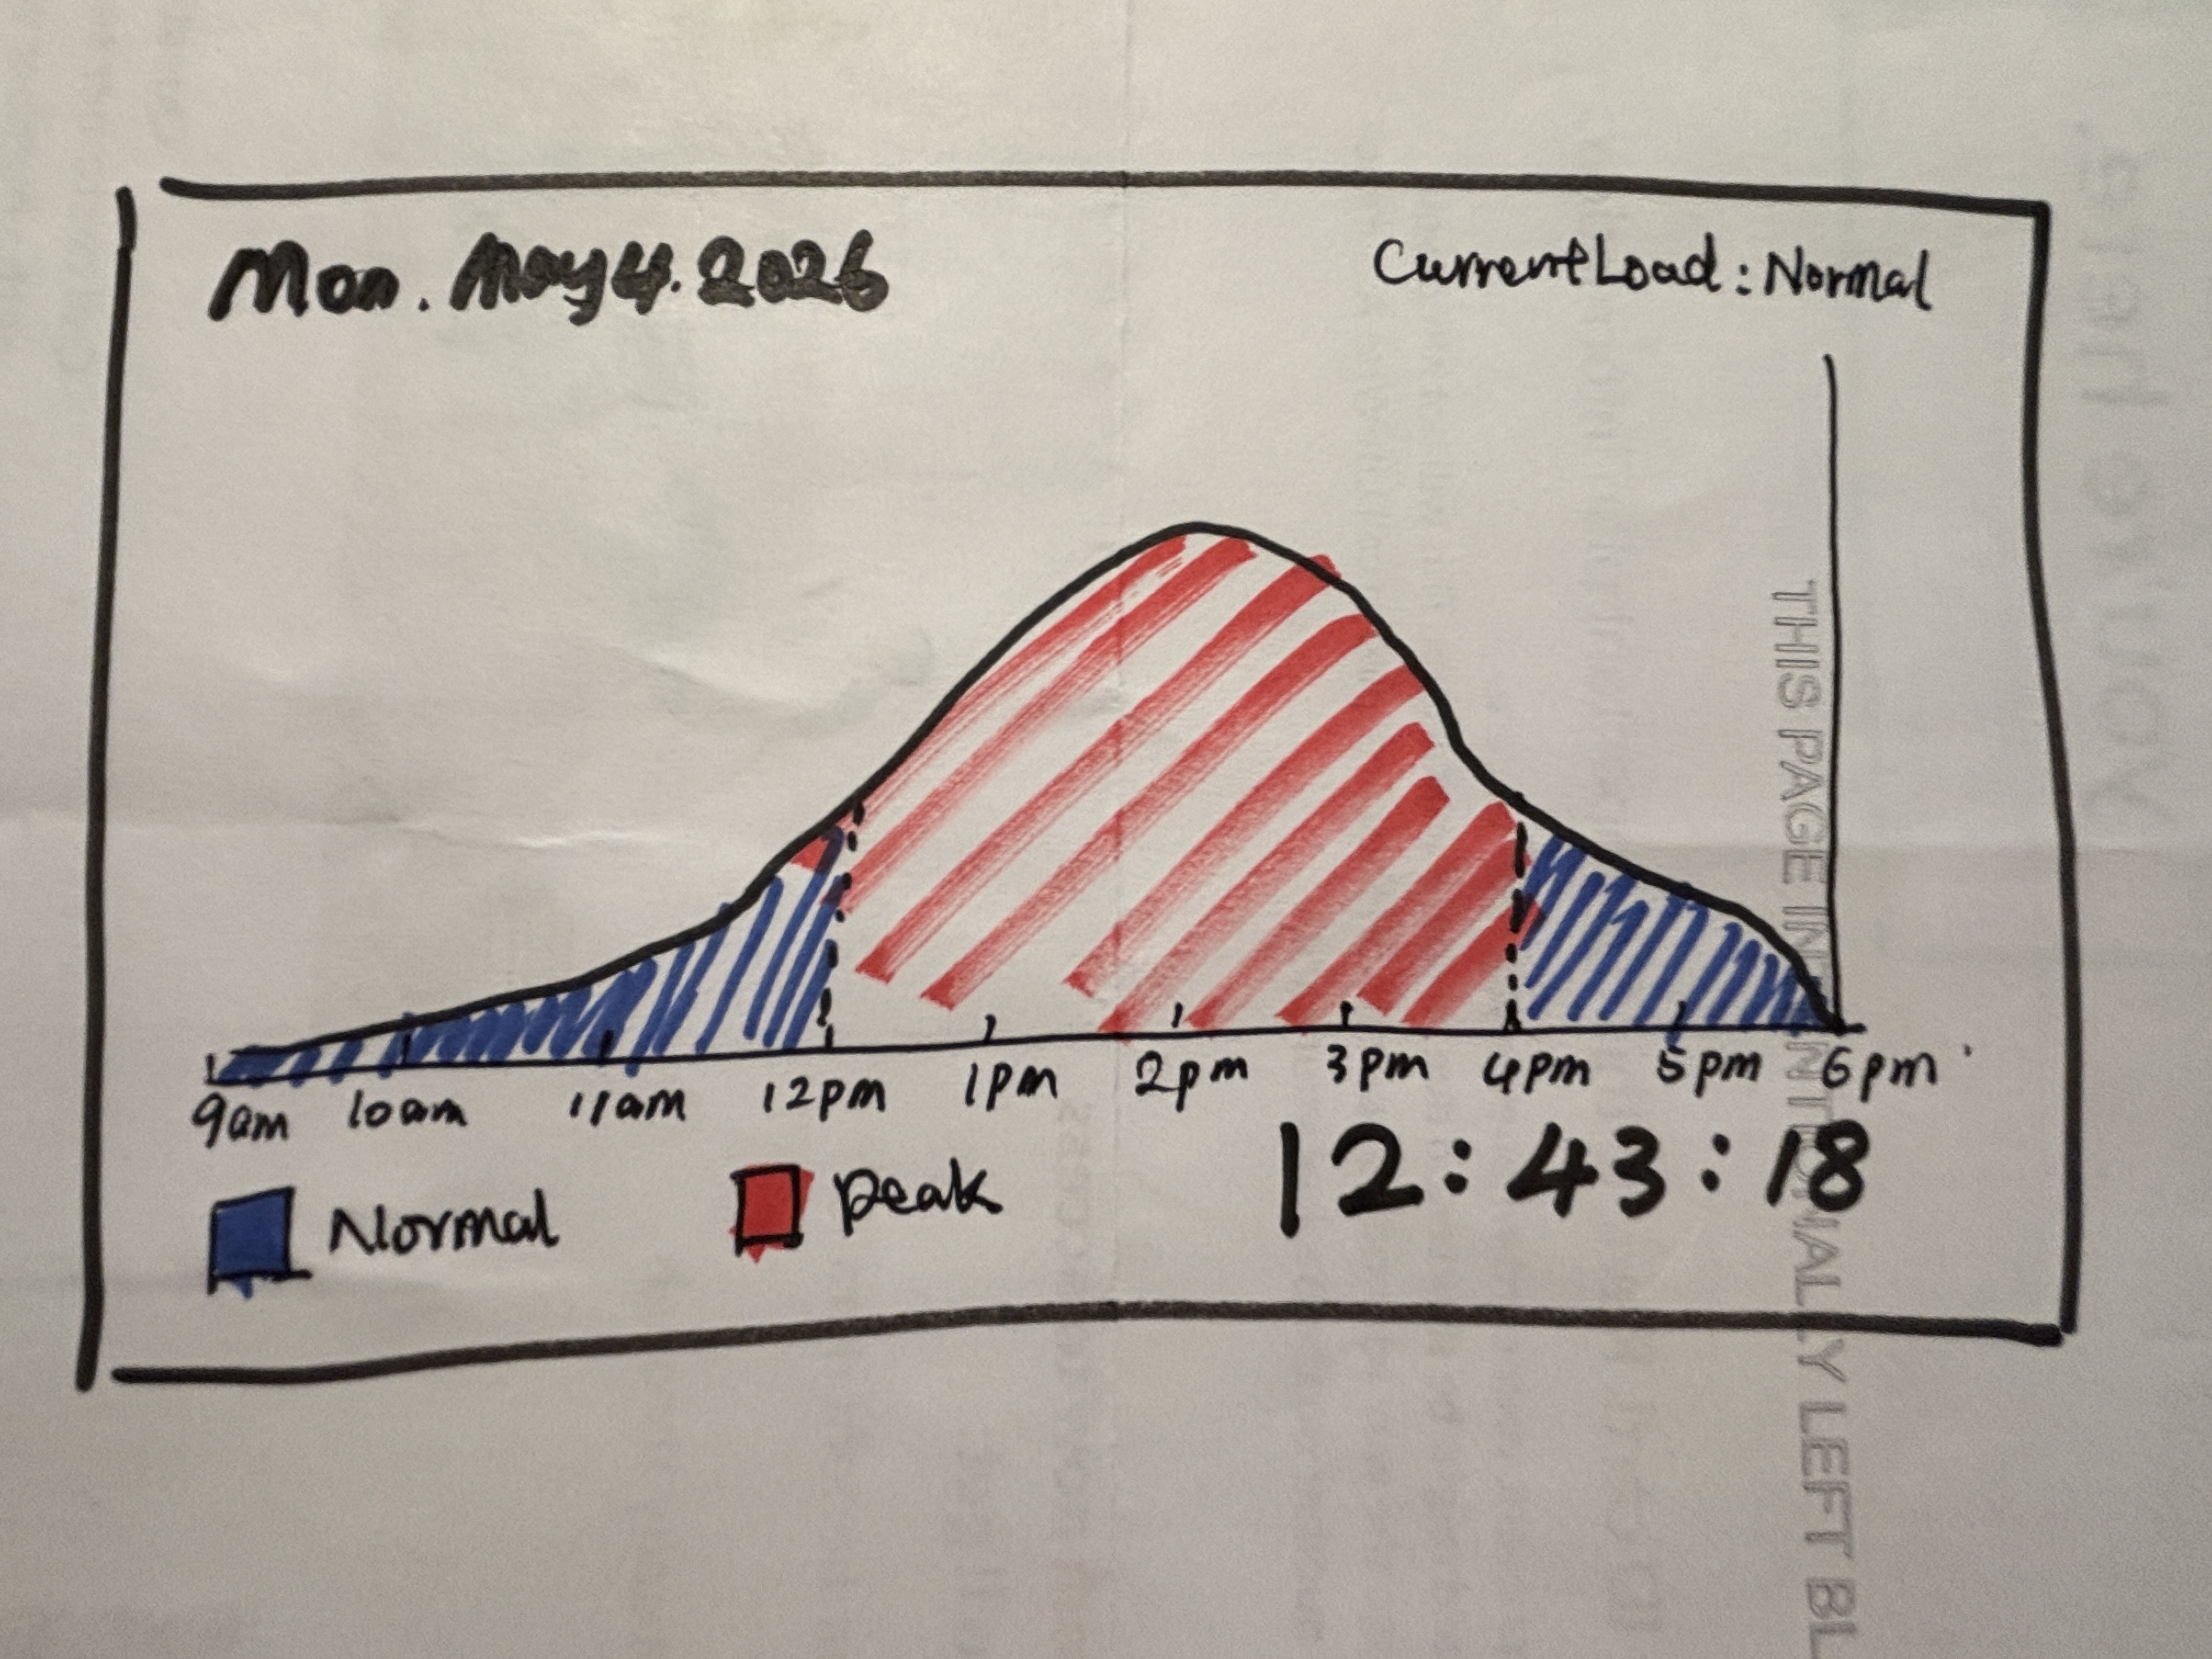
Design process: I designed time as a continuous workload wave instead of separate calendar blocks. Based on feedback, I simplified the wave shape, improved the red/blue contrast, and made the time axis clearer so users can quickly identify peak meeting periods. I applied readability, visual hierarchy, color contrast, and motion to make the clock easy to scan.

Time encoding: Hour is shown through the wave trend across the day; minute is represented by wave amplitude and meeting intensity; second is shown through subtle motion; red highlights peak meeting density.

Self-reflection / future work: I would connect this clock to real calendar data so the wave reflects actual meetings. I would also add hover details for each meeting period so users can inspect specific events without cluttering the main view.

Documenting Iterative Process

Context of use: This clock is designed for focused work sessions. I chose this context because I often lose track of time while working and wanted a less stressful alternative to countdown timers. The design helps users stay aware of time while keeping the experience playful and motivating.

Final Clock 2 — Cat & Fish Clock

Sketch iteration documentation (paper / hand-drawn photos)

Cat and Fish Clock hand-drawn sketch
Initial sketch: fish act as time units, and the cat becomes the moving time marker.
Cat and Fish Clock final digital design
Final version: structured fish grid, large timer, and animated cat movement.

Design process: I selected Cat & Fish Clock because it is the most memorable and engaging concept. Based on feedback, I made the fish layout more structured, enlarged the current time display, aligned the cat’s movement with the disappearing fish, and simplified the visuals to improve clarity. I applied layout, hierarchy, motion, and playful visual metaphor to make time easier to perceive.

Time encoding: Hour is represented as one full reset cycle; minute is shown through the number of remaining fish; second is represented by the cat’s movement and eating animation.

Self-reflection / future work: I would improve this by adding smoother eating transitions so the fish disappear more naturally. I would also add a small hover interaction explaining which time unit each fish represents.

Adapted from Golan Levin, 2016-2018

more details next week